Feature Engineering Explained: The Secret Sauce of Machine Learning
You've heard the saying: "Garbage in, garbage out." Well, in machine learning, it's more like: "Good features in, great models out."
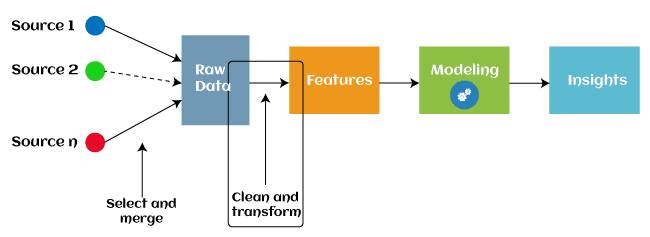
Feature engineering is often called the secret sauce of data science. It's the art—and science—of transforming raw data into meaningful inputs that help machine learning models perform better. While algorithms get all the glory, feature engineering is what separates average models from world-class ones.
Let's break it down.
What is Feature Engineering?
Feature engineering is the process of selecting, manipulating, and transforming raw data into features that better represent the underlying problem to predictive models.
A feature is simply an individual measurable property of your data. Think of it as a column in your dataset—age, income, temperature, purchase history, etc.
The goal? Make it as easy as possible for your model to find patterns and make accurate predictions.
Simple analogy: Feature engineering is like preparing ingredients before cooking. You don't throw a whole chicken into a pan—you chop, season, and marinate. Same with data.
Why Does Feature Engineering Matter?
Here's the truth: Better features = better models. It's that simple.
Consider this:
-
A complex model with bad features → poor performance
-
A simple model with great features → excellent performance
Real-world proof: In many Kaggle competitions, feature engineering is what separates winners from the rest. Competitors spend 60-70% of their time on feature engineering, not model tuning.
The Benefits:
-
Improves model accuracy
-
Reduces overfitting (simpler features generalize better)
-
Speeds up training (fewer irrelevant features)
-
Provides insights (you understand your data better)
-
Makes models more interpretable
The Feature Engineering Process
Step 1: Understand Your Data
Before engineering anything, explore your data. Understand:
-
What each column means
-
Missing values and outliers
-
Relationships between variables
-
Domain context (talk to subject matter experts!)
Step 2: Create New Features
Transform existing data into more useful forms.
Step 3: Select the Best Features
Not all features are useful. Some add noise. Some are redundant. Feature selection helps you keep only what matters.
Step 4: Evaluate
Test how your new features impact model performance. Iterate.
Common Feature Engineering Techniques
1. Handling Missing Values
Missing data is everywhere. You can:
-
Impute – Fill with mean, median, mode, or predicted values
-
Drop – Remove rows/columns with too many missing values
-
Flag – Create a binary column indicating "missing" (sometimes missingness itself is informative)
2. Encoding Categorical Variables
Machine learning models need numbers, not text. Convert categories:
| Technique | When to use |
|---|---|
| One-Hot Encoding | Nominal categories (colors, cities) with few unique values |
| Label Encoding | Ordinal categories (low, medium, high) |
| Target Encoding | When there's a clear relationship with the target variable |
| Frequency Encoding | Replace categories with their frequency count |
3. Scaling and Normalization
Different scales can confuse models. Fix it:
-
Standardization – Scale to mean=0, standard deviation=1
-
Min-Max Scaling – Scale to range [0,1]
-
Robust Scaling – Use median and IQR (handles outliers better)
Note: Tree-based models (Random Forest, XGBoost) don't need scaling. Linear models and neural networks do.
4. Feature Transformation
Sometimes raw features don't show the true pattern. Transform them:
-
Log Transformation – Reduces skew, handles exponential growth
-
Square Root / Box-Cox – Stabilizes variance
-
Polynomial Features – Captures non-linear relationships (x², x³)
-
Binning – Group continuous values into buckets (age: 0-18, 19-35, 36-60, 60+)
5. Interaction Features
The combination of two features might be more predictive than each alone.
Example: Predicting house prices? Instead of just length and width, create area = length × width.
Other interactions:
-
Ratio: debt_to_income = debt / income
-
Difference: age_difference = age_older - age_younger
-
Product: price × quantity = total_sales
6. Aggregation and Grouping
Group data and create summary statistics:
-
Mean, median, max, min, count, standard deviation
-
Rolling averages (for time series)
-
Cumulative sums
-
Lag features (previous values)
Example: For customer data, instead of just individual purchases, create:
-
Total spending per customer
-
Average purchase value
-
Days since last purchase
-
Purchase frequency
7. Date and Time Features
Dates hide many patterns. Extract them:
-
Day of week, month, quarter, year
-
Day of year, week number
-
Is weekend? Is holiday?
-
Time since previous event
-
Hour of day (for time-based data)
8. Domain-Specific Features
This is where expert knowledge shines.
In finance:
-
Debt-to-equity ratio
-
Volatility (standard deviation of returns)
-
Moving averages
In healthcare:
-
BMI = weight / (height)²
-
Age-adjusted risk scores
-
Comorbidity counts
In e-commerce:
-
Customer lifetime value (CLV)
-
Cart abandonment rate
-
Average order value (AOV)
Golden rule: Talk to domain experts. They know patterns you won't find in the data.
9. Dimensionality Reduction
Too many features? Reduce them:
-
PCA (Principal Component Analysis) – Creates new uncorrelated features
-
t-SNE / UMAP – Great for visualization
-
Autoencoders – Neural network-based reduction
10. Feature Selection
Not all features earn their keep. Remove the dead weight:
| Method | How it works |
|---|---|
| Correlation | Remove highly correlated features |
| Variance Threshold | Remove features with near-zero variance |
| Mutual Information | Measure information gain with target |
| Forward/Backward Selection | Add or remove features iteratively |
| LASSO / Regularization | Shrinks unimportant coefficients to zero |
| Feature Importance | Tree-based models show importance scores |
Feature Engineering Best Practices
DO:
-
Start simple – Build a baseline before getting fancy
-
Understand domain – Talk to experts
-
Iterate – Test, evaluate, refine
-
Document everything – Future you will thank you
-
Use cross-validation – Avoid overfitting to validation set
-
Monitor feature stability – Features should be consistent over time
DON'T:
-
Don't leak target information – Never use future data to create features
-
Don't over-engineer – Too many features = overfitting
-
Don't ignore missing data – Be intentional about handling it
-
Don't forget to scale – If you scale, scale all numeric features
-
Don't create features without testing – Does it actually improve performance?
The Danger: Data Leakage
This is the #1 mistake in feature engineering.
Data leakage happens when you use information in your features that wouldn't be available at prediction time.
Examples:
-
Using future sales to predict current sales
-
Normalizing using the entire dataset (including test data)
-
Creating features from the target variable
Prevention:
-
Split data before feature engineering
-
Use pipelines to ensure consistency
-
Always think: "Would I have this info at prediction time?"
Feature Engineering vs. Feature Learning
You might wonder: "Can't AI just learn the features?"
| Feature Engineering | Feature Learning (Deep Learning) |
|---|---|
| Human-crafted | Algorithm-learned |
| Interpretable | Often a black box |
| Domain knowledge needed | More data, less knowledge |
| Works with small data | Needs massive data |
| Faster training | Slower, more compute |
Bottom line: Both have their place. Use feature engineering for tabular data, structured problems, and when interpretability matters. Use deep learning for images, text, and when you have huge datasets.
Real-World Example: Predicting House Prices
Let's see feature engineering in action.
Raw features:
-
bedrooms,bathrooms,sqft_living,sqft_lot,year_built,zipcode
Engineered features:
-
total_rooms = bedrooms + bathrooms -
house_age = 2026 - year_built -
sqft_per_room = sqft_living / total_rooms -
lot_per_sqft = sqft_lot / sqft_living -
zipcode_mean_price– average price per zipcode (aggregation) -
is_renovated– 1 if year_renovated > 0 -
season_sold– from date column
Result: A simple linear model with these features often outperforms complex models using raw data.
Quick Reference: Feature Engineering Cheat Sheet
| Data Type | Techniques |
|---|---|
| Numeric | Scaling, log transform, binning, polynomial |
| Categorical | One-hot, label encoding, frequency encoding |
| DateTime | Day, month, quarter, is_weekend, time_since |
| Text | TF-IDF, word counts, embeddings, length |
| Missing values | Impute, drop, flag |
| Aggregations | Mean, max, min, count, rolling windows |
| Domain | Ratios, differences, products, expert rules |
Final Thought: The Unseen Superpower
Feature engineering is often called the "dark art" of data science. But it's not magic—it's a combination of domain knowledge, creativity, and systematic experimentation.
The best data scientists don't just throw data at algorithms. They understand their data intimately. They craft features that tell the story hidden in the numbers. They make it easy for their models to succeed.
Remember:
-
A great algorithm with bad features = mediocre model
-
A simple algorithm with great features = winning model
So invest in feature engineering. Explore your data. Talk to experts. Iterate relentlessly. Your models—and your stakeholders—will thank you.
Contact Us
Phone: +91 9667708830
Email: info@codingnow.in
Website: https://codingnow.in/
Address:
2nd Floor, Kapil Vihar (Opp. Metro Pillar No.354)
Pitampura, New Delhi – 110034
Backlink to main website: Explore Python and AI courses at Coding Now – Gurukul of AI
