Data Pipelines Explained: The Invisible Backbone of Modern Data
Imagine you run a global e-commerce store. Every second, data is pouring in: customer clicks, payment transactions, inventory updates, shipping tracking numbers, and website analytics.
Now, imagine trying to answer a simple question: "How many red sneakers did we sell in Europe yesterday?"
If your data is scattered across 10 different databases, in 5 different formats, and it takes 3 hours to clean and combine it manually—you’re in trouble. By the time you get the answer, it's already outdated.
This is exactly why we need Data Pipelines.
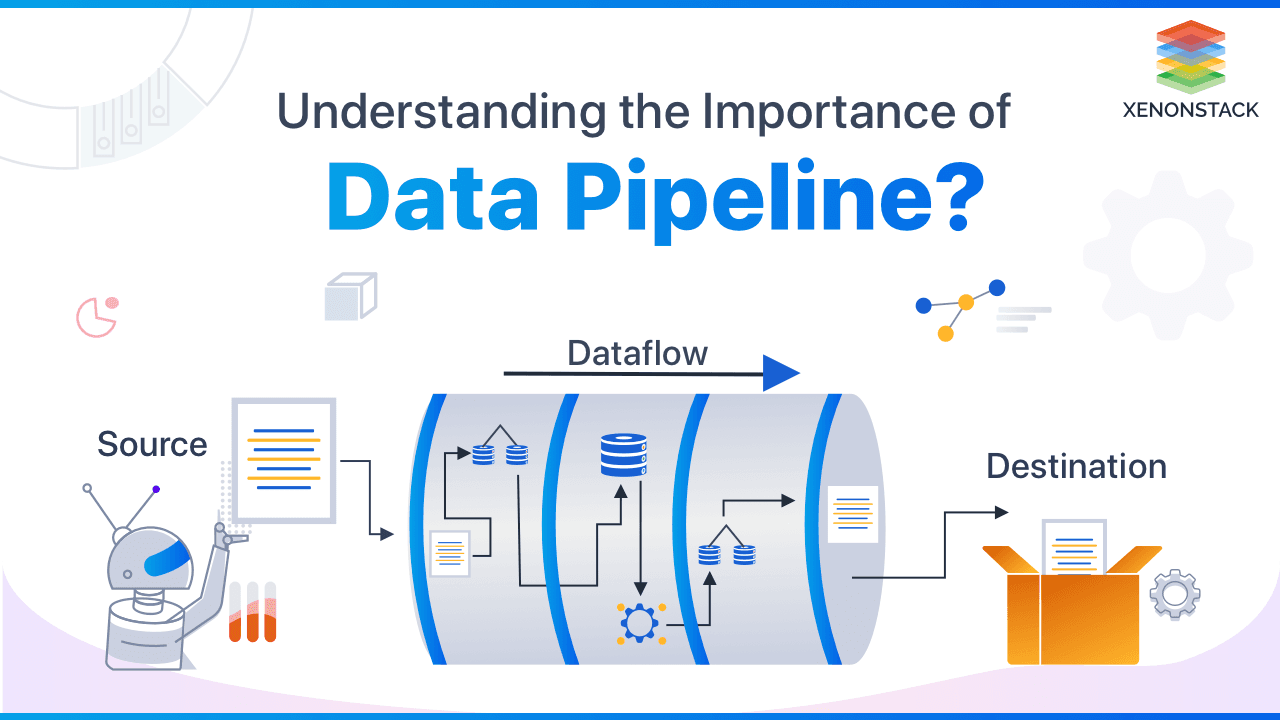
A data pipeline is the automated system that moves, transforms, and organizes data from point A (where it's generated) to point B (where it's analyzed and used). Think of it as a highway system for data—moving raw materials (data) from source to destination, while cleaning, sorting, and packaging them along the way.
In this guide, we'll break down what data pipelines are, how they work, the different types, and why they matter more than ever in the age of AI and real-time analytics.
What Exactly is a Data Pipeline?
At its simplest, a data pipeline is a series of steps that process data.
Let's use a real-world analogy: A Car Wash.
-
Source: A dirty car arrives (your raw data).
-
Ingestion: The car enters the tunnel (data enters the pipeline).
-
Processing: It goes through soap, scrubbing, rinsing, and drying (data is cleaned, transformed, and enriched).
-
Destination: A clean, shiny car comes out (processed data is loaded into a data warehouse or database).
-
Consumption: The clean car is ready for the customer (analysts, dashboards, or machine learning models can now use the data).
Key Takeaway: The pipeline is not just about moving data; it's about improving it. Raw data is often messy. A pipeline turns that mess into gold.
The 5 Core Stages of a Data Pipeline
While every pipeline is unique, most follow a similar lifecycle. Let's look at each stage using a practical example: Processing sales data for a retail chain.
1. Ingestion (The Source)
This is where data enters the pipeline. Data can arrive in different ways:
-
Batch: Data is collected and moved in chunks at scheduled times (e.g., "At midnight, upload all of yesterday's sales").
-
Streaming (Real-time): Data is moved continuously as it happens (e.g., "Every credit card swipe is sent instantly to the pipeline").
-
Source Systems: This could be app databases (PostgreSQL), flat files (CSVs), APIs (like Stripe or Salesforce), or IoT sensors.
2. Processing (The Transformation)
This is the most important and complex stage. Raw data is rarely ready for analysis. Transformation includes:
-
Cleaning: Removing duplicates, fixing typos, handling missing values (e.g., filling in a blank "State" column using the ZIP code).
-
Formatting: Standardizing date formats (changing
MM/DD/YYtoYYYY-MM-DD) and currency conversions (e.g., converting Euros to USD). -
Joining: Combining data from different sources (e.g., linking the
Salestable with theProductstable to get product names). -
Aggregating: Summarizing data (e.g., calculating total sales per store per day).
3. Destination (The Sink)
After the data is clean and transformed, it needs to be stored somewhere for use. Common destinations include:
-
Data Warehouses: Centralized repositories for structured data (e.g., Snowflake, Google BigQuery, Amazon Redshift).
-
Data Lakes: Storage for raw, unstructured data (e.g., AWS S3).
-
Databases: Operational databases for apps.
4. Workflow Orchestration (The Conductor)
A pipeline doesn't run itself. It needs a "conductor" to schedule tasks, monitor progress, and handle failures.
-
Example: "Step 1: Ingest data at 10 PM. Step 2: Wait until Step 1 finishes, then transform it. Step 3: If Step 2 fails, send an alert. Step 4: Load the data."
-
Tools: Apache Airflow, Prefect, Dagster.
5. Monitoring (The Health Check)
Data pipelines can break. Sources change, servers crash, or bad data slips through. Good pipelines have monitoring to track:
-
Data Volume: "Did we receive the expected number of rows?"
-
Data Quality: "Are there null values in critical columns?"
-
Latency: "How long did the pipeline take to run?"
Batch vs. Streaming Pipelines (The Two Flavors)
Not all pipelines are built the same. The choice depends on how fast you need the data.
Batch Pipelines (Traditional)
-
How it works: Data is collected over a period (e.g., an hour, a day) and processed in large groups ("batches") at scheduled times.
-
Latency: High (hours to days).
-
Use Cases: Generating daily sales reports, monthly financial reconciliations, training machine learning models overnight.
-
Pros: Simpler, cheaper, more forgiving of errors.
-
Cons: You are looking at the past, not the present.
Streaming Pipelines (Real-Time)
-
How it works: Data is processed continuously as soon as it is generated, often within milliseconds.
-
Latency: Low (sub-second to seconds).
-
Use Cases: Fraud detection (blocking a suspicious transaction immediately), real-time inventory tracking, live dashboards, recommendation engines.
-
Pros: Up-to-the-second insights.
-
Cons: More complex, more expensive, harder to debug.
The Modern Approach: Many companies use a hybrid model called Lambda Architecture—they run a streaming pipeline for real-time alerts and a batch pipeline for deep historical analysis.
The Modern Data Stack (Tools You Should Know)
If you're entering the data space, you'll hear these names constantly. Here's a simple cheat sheet:
| Stage | Popular Tools |
|---|---|
| Ingestion | Fivetran, Stitch, Airbyte, Debezium (CDC) |
| Transformation | dbt (Data Build Tool), Spark, SQL, Python (Pandas) |
| Orchestration | Apache Airflow, Prefect, Dagster |
| Destination | Snowflake, BigQuery, Redshift, Databricks |
| Visualization | Tableau, PowerBI, Looker, Metabase |
Why Data Pipelines are Critical (The Business Case)
Why should a business invest time and money in building pipelines?
-
Single Source of Truth: Pipelines ensure everyone in the company is looking at the same, clean data. No more debates about "My spreadsheet says 100, but your dashboard says 150."
-
Speed to Insights: Analysts no longer spend 80% of their time cleaning data. They can focus on analyzing it and making decisions.
-
Scalability: Pipelines are automated. They can handle billions of rows of data without requiring a human to manually run scripts.
-
Reliability: Automated pipelines don't forget to run. They retry on failure and send alerts if something goes wrong.
-
AI Readiness: Machine learning models need fresh, clean data to make accurate predictions. A pipeline feeds that lifeblood to your AI.
Common Challenges (It's Not All Smooth Sailing)
Building a pipeline is hard. Here are the pitfalls to avoid:
-
Data Drift: The source data changes schema (e.g., a new column is added) and breaks the pipeline.
-
Backfill Hell: When you change the transformation logic, you often have to "replay" the pipeline from the beginning to fix historical data.
-
Cost Overruns: Processing huge volumes of data costs money. Poorly optimized pipelines can burn cash.
-
Latency vs. Cost: Real-time is expensive. Determine the minimum speed you actually need.
The Future: The Rise of "DataOps"
Data pipelines are no longer an afterthought; they are a core infrastructure component, just like servers and networks.
DataOps (Data + DevOps) is the movement to apply software engineering best practices—like version control (Git), CI/CD, automated testing, and monitoring—to data pipelines.
Just as you wouldn't deploy a website without testing it, you shouldn't run a pipeline without data quality tests.
Final Thoughts
Data pipelines are the unsung heroes of the digital age. They work in the background, tirelessly moving and transforming data so that businesses can make smart decisions, apps can run smoothly, and AI models can learn.
If you are starting a data project—whether it's a simple weekly report or a massive AI initiative—remember this: Before you can analyze, you must automate.
Start small. Build a simple batch pipeline. Get it right. Then make it faster. Because in the world of data, the winners aren't just those with the most data—they are those who can move it fastest.
Contact Us
Phone: +91 9667708830
Email: info@codingnow.in
Website: https://codingnow.in/
Address:
2nd Floor, Kapil Vihar (Opp. Metro Pillar No.354)
Pitampura, New Delhi – 110034
Backlink to main website: Explore Python and AI courses at Coding Now – Gurukul of AI
